
Over 30 years of anarchist writing from Ireland listed under hundreds of topics
 The Sunday Times with Behaviour & Attitudes have run two very useful polls that give a strong sense of how the campaign to Repeal the 8th Referendum is going. The overall story the poll results tell is bad for the Vote No campaign and promising for the Vote Yes campaign. If the referendum had been held at the time of the March poll then Repeal would have been carried by 64% to 36%, almost 2:1. The polling data also shows No has a soft vote that is very much larger proportion than the equivalent soft Yes vote. This means if anything between now and referendum day the polls are likely to drift towards repeal.
None of this is a reason for complacency, what the No side lacks in terms of numbers and support they make up for in terms of funding. Before the campaign had even started they were spending hundreds of thousands on online advertising, billboards, leaflets and free buses to what had to be their disappointingly small March 10th national march. Together for Yes may have far more support and more people out canvassing but will it have enough to defeat all that paid advertising?
As this is a long read we are also making an audio version available
That is a question that will be answered on referendum day and the answer will be determined by the work put in between now and then, both in terms of formal canvassing teams but also - and at least as important - in dozens of conversations at home, at work and out with friends. But here we want to look into the detail of the polls, in part because it helps guide those conversations. As well as looking at the results of each of these two polls we can also look at what changed between them, and presuming there are similar polls in future check back in from time to time.
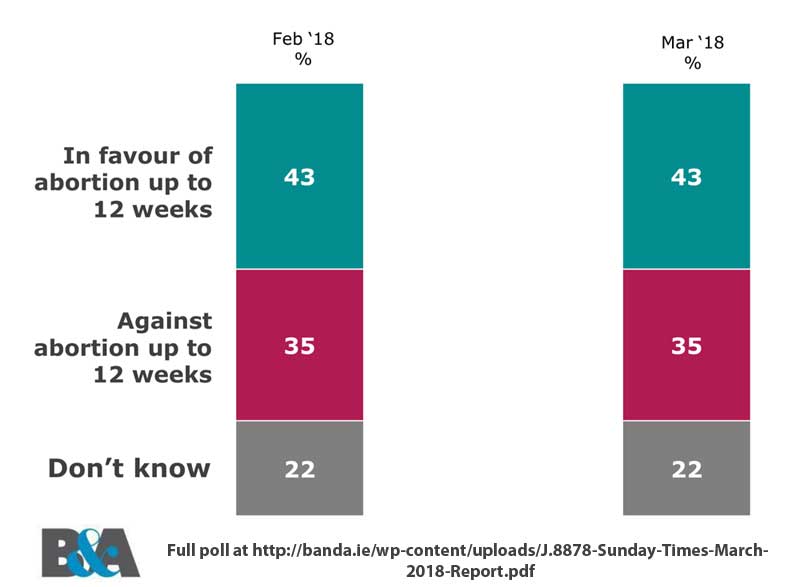
The first poll was carried out over the first two weeks of February, the second in the second week of March. In terms of the overall question of which way people will vote in the Repeal referendum the two polls showed little change, both showed 49% of people were voting yes. There was bad news for the vote No campaign as not only were only 30% intending to vote No in the February poll but this actually fell by the time of the March poll to 27%. In the March poll some 20% of people Didn’t Know which way they would vote and 4% said they had decided not to vote. It’s when we exclude these last two groups that we get the 64% Yes to 36% No mentioned above.
This discussion will draw numbers from the four polls linked below but it mostly works off a Behaviour & Attitudes poll reported on by the Sunday Times in March so we recommend you download that and read this text with it open as we will be referring to specific pages of that report.
It’s useful to understand some technical details of polling so we don’t try and read more out of them than we should. The error on a poll of this size (900 voters) is a little over 3%. This is because a random sample of 900 people from the Irish population will not be exactly representative of the total population. There is a 95% chance that the percentages in a poll of this size will be within 3.3 points of the actual percentage if people voted in the referendum that day. In other words we can’t really say much about apparent difference that are less than 3%.
This error margin increases as the poll size reduces, a poll of 96 people will have an error margin of +/- 10%. This is important for the discussion that follows because the most useful aspect of these polls is when they break the results down to subgroups, for example Fianna Fail voters or Farmers. Because these are a subgroup of the total poll of 900 they will be smaller, many are about 300 people.
In some cases these subgroups are too small for any meaning to be derived, for instance in the first poll 80% of Green Party voters were voting Yes and by the second this had risen to 100%. The problem though is that there are not many Green Party voters and these percentages come from sub sample sizes that are tiny, just 9 people in the second poll. The error margin is too vast to draw any conclusion at all from those numbers.
Likewise the figures for farmers are also initially fascinating until you see there are only 36 farmers in the 2nd poll, again meaning such a huge error margin that attempts at interpretation are futile. So later on when we look at the number for various sub populations we will only be interested in those that show major gaps and major changes, in the order of 5% (a poll of 384 would have a 5% accuracy) and where the subpopulation contains hundreds of people.
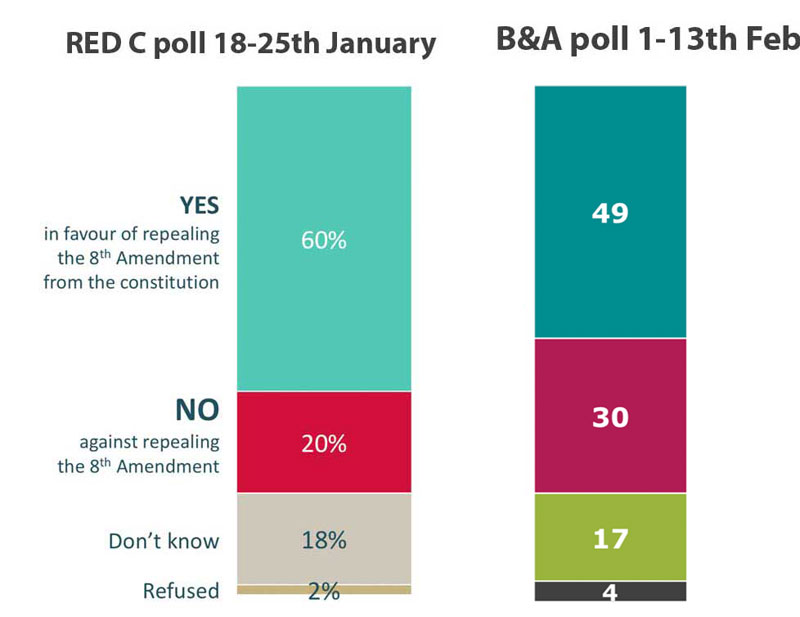
In this piece we are focusing on the Behaviour & Attitudes / Sunday Times polls. Red C also carried out two polls in the same period, the second of which attracted attention as it appears to show a large swing from Yes to No in comparison with their first poll. It appears to us that something went wrong with that first poll as the B&A poll taken less than a week later had a startlingly different result which would require a 21 point swing against Yes in the period before any significant campaigning had taken place.
Note - we uploaded the wrong comparison in the first version of this article, thats corrected above.
Excluding RedC 1 the three remaining polls don’t have such wild swings although the different methodology and question phrasing of the Red C polls would complicate direct comparisons. For what it’s worth the No vote across the three polls goes from 30 (B&A 1) to 27 (B&A 2) to 26 (RedC 2). RedC 1 with a No of 20 would not fit well at the start of that sequence and if it actually measured anything as opposed to being the product of an error it was measuring something other than the impact of campaigning.
In terms of strategy both sides of the referendum will pay most attention to 3 blocks of voters and mostly ignore two other blocks. The mostly ignored ones are called the ‘hard yes’ vote and the ‘hard no’ vote. These are people who are very unlikely to switch votes and canvassers will be trained to not waste time talking to them as the time is better spent with the three other groups .
We do of course want to encourage the ones voting hard Yes to definitely get out and vote - this could be key to winning Repeal - but arguing with a hard No would in most cases be a complete waste of time. In particular as the hard No’s are close in size to the percentage who opposed the very very limited reforms of the Protection of Life During Pregnancy act which was designed to deal only with cases where the women would die if denied a termination. The hards Nos are pretty much that ‘let women die’ bloc.
These are three groups whose opinions both sides will try and spend time shifting
1. The ‘soft Yes’ voters who are voting yes but unsure about aspects of a women's right to choose. Typically they only want women to be able to access abortions for some reasons and not others..
2. The Don’t Knows that have not yet decided how to vote but who do intend to vote.
3. The ‘soft No’ who are against a women’s right to choose but perhaps think there are some circumstances eg Fatal Foetal Abnormality (FFA) where access to abortion should be granted.
In these polls and it would appear in the internal polling of all the campaigns the key issues that are being used to identify the soft voters are, for the Yes vote whether they are voting Yes but oppose abortion on request up to 12 weeks and on the No side whether they are voting No but support access to abortion in cases of Fatal Foetal Abnormality (FFA) and threats to the health of the women. Fairly obviously someone who intends to vote No but feels abortion should be available in the case of FFA or where there is a threat to the women’s health should be possible to convince that they should vote Yes so this can happen.
The No campaign will target soft Yes voters by trying to steer the conversation onto the 12 week access on request issue. Typically this is done by trying to create categories of women who deserve access to abortion and those who do not. So even though the No campaign are against abortion in all cases they will try and chip away at the soft Yes, for instance through the favourite myth of women using abortion as contraception because they are lazy.
Likewise the Yes campaign will target the soft No’s by explaining that if they vote No they will be stopping women with (FFA) from accessing abortion in Ireland - only Repeal will mean the legislation required to access such medical care in Ireland can be passed.
To a very large extent this means that the No campaign will want to centre discussions on the 12 week issue while the Yes campaign will want to centre it on FFA and threats to the women health. Both will have to be able to provide answers to its own ‘soft Yes’ voters to avoid losing them but as far as possible they don’t want the conversation centered there.
The Sunday Times polls directly asked those polled on their attitudes on both these question so they give a very good indication of the relative side of these five important blocs and over time the movement between them. From looking at all these responses (p13 to p17) we can say that the March poll would divide the population up as follows;
It may be a little bit hard to get your head around where we have produced these numbers from so hopefully the accompanying graphic will help. It hacks together three of the Sunday Times / Behaviour and Attitude graphics around the key questions to allow us to visually focus in on the soft voters for each side.
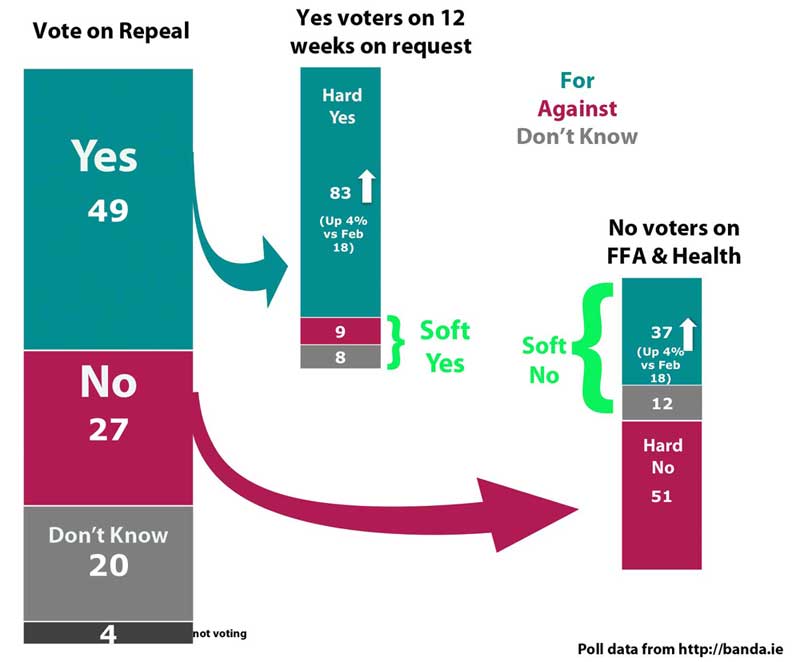
Both the images and the figures above show the difficulty the No campaign is in, it has a comparatively small hard No vote (51% of their 27% of the vote) and a comparatively large soft No which grew 4 points over the month. Together for Yes not only starts off with what would be a 64% Yes but this is mostly Hard Yes (83% of their 49% of the vote) and the Soft Yes is small and shrunk 4 points over the month.
About 42% of voters in total are either undecided or soft but the large hard Yes percentage at 40% means that for Repeal to win we only need to win 1 in 4 of those soft and undecided votes. The referendum can certainly be still lost with these numbers - in referendums Don’t Knows often become No.
If you look at the four different polls the weekend before the 2015 Marriage Equality vote you see huge differences in the polls according to which company carried them out but also that with then MRBI and Millward Brown polls that still showed high numbers of Don’t Know’s much more became No than Yes on the day. http://www.thejournal.ie/marriage-referendum-poll-analysis-2109857-May2015/
There is worse news for the anti-choice campaigns when we look at the movement between the two polls. As already stated the March poll shows them losing 3% of the vote who become undecided. To be clear this is within the 95% probability but would be at a less stringent 90% probability. To explain at 95% probability there is one chance to 20 you are wrong, at 90% this falls to 1 in 10. A shift between the two polls can also be seen in the health & FFA question (p17) where the percentage of No voters who are actually in favour of access to abortion in these circumstances rises from 33% in February to 37% in march.
The February poll was carried out as the wording of a probable referendum became clear but before any campaigns had really been launched. The March poll was carried out before the Together for Yes campaign had been launched but right in the thick of the anti-choice campaign launches and in particular of their huge advertising spend that saw anti-choice billboards erected all over the country. This was also the context of their failed attempt to mobilise large numbers for a national demonstration on 10th March, slap bang in the middle of the week polling was carried out.
In other words Vote No were dominating news reporting and they had billboards, truck ads and leaflets all over the country while very little was visible of Vote Yes. To lose almost half of your soft No’s under such conditions is extraordinary. We shall see though that it’s a little more complex and there are some warnings for the Yes campaign as we dig deeper into the breakdown of figures.
Again at this headline level the No campaign got off to a terrible start, despite being far more visible and spending a huge amount they not only failed to dent the soft Yes they actually lost some of their soft No’s.
No spokespeople have looked at these polls and have access to their own internal polling which will be showing similar results. We get some clue as to their alarm from what they are tweeting about the polls and what they are tweeting about canvasses. On the polls they are actively trying to mislead their own supporters by comparing the eventual result of the Marriage equality poll with what they describe as a 76% Yes poll near the start of the campaign and then contrasting that with the 49% Yes above. http://www.thejournal.ie/opinion-poll-2015-same-sex-marriage-1882262-Jan...
What’s misleading is that the January 2015 ME poll excluded Don’t Knows to get that 74% Yes, if you do the same and exclude Don’t Knows from The B&A poll the Yes rises from 49% to 64%.
It’s true the Marriage Equality referendum eventually passed by 62%, a drop of 14% from that first poll. However… that first ME poll was also a Red C poll so in this case the real equivalent would be equally out of place first Red C poll back in January this year. Exclude Don’t Knows from that January poll and Yes is at 75 so a similar 14% drop from the first poll would see Yes winning at 61%. Red C polls consistently had too high a Yes vote in advance of Marriage Equality, something they explained by talking about a ‘shy vote’ that was unwilling to tell them how they really intended to vote for fear of taking an unpopular stance.
Observing the No spokespeople on Twitter we’ve seen a lot of effort going into trying to shore up canvasser moral by posting positive claims about canvassing which just happen to from the areas of the country that voted against Marriage Equality or only passed it by narrow margins. But we’ve also seen the replies from their canvassers in Dublin saying they are finding it very tough going. A lot of the online No paid ads have a very strong emphasis on trying to recruit canvassers, this from a campaign whose spokespeople have been boasting they have been organised for months. It’s hard not to conclude that they are already facing major demoralisation problems.
Are both Yes and No voters equally likely to get out and actually vote on referendum day? The tables on page 24 where Yes & No voters are asked how likely it is that they will actually vote in a general election are our best approximation in these polls. Not too much can be drawn directly from this as it’s unlikely a general election will take place on the day of the referendum - but we might assume that the intentions to vote would be similar so large differences here might matter. As it turns out there are few surprise’s here to upset the calculation above, Yes and No voters are jointly a little more sure they will be voting than the Don’t Knows but there is no significant difference between the intentions of Yes & No voters which might tilt the result.
The table on p26 which combines likelihood to vote with attitudes to 12 weeks without restriction however shows those against unrestricted access to 12 weeks are quite a bit less likely to vote than those for unrestricted access. This is good news for Together for Yes as it suggest the potential soft Yes vote here is less likely to stay at home, but this is within the margin of error.
The table on p29 combines likelihood to vote with attitudes to abortion access for threats to health and FFA. It is the No voters that are less likely to vote here, if by a narrower margin.
 One area of major concern for Pro-choice campaigners would be the table on page 31 which breaks likelihood to vote down by age. Here only 60% of under 34s feel they would definitely vote but 80% of over 55s - the one bloc likely to vote No - feel they would definitely vote. If that gap played out in the referendum it would close the gap between Yes and No by a couple of points and in a close referendum could result in a victory for the No side. Both the US Trump election and the UK Brexit vote had the results they did because of the different turns outs of the similar age groups there in what were very close votes. Will this happen here, it would be a rather grim irony if the over 55s turned out in numbers to defeat the access to the healthcare that no longer has relevance to them but which the 18-35s are most likely to need and least likely to bother to go to the polling station for!
We can now move on to the other tables that divide into sub-populations based on gender, age, class and party support. Each of these tells an important tale providing we keep sample size in mind - the error margin increases to 4.5% and more for these subsamples.
For the most part there is little to learn here on of Yes voters as the differences between men & women are within the error margins, only 1% off the overall voting average intention for the Yes vote. On the No vote though it does appear that women are somewhat more likely to be No voters, a 5 pt gap and in comparison between the two polls this gap opened up during the first month of the campaign because the percentage of No voting men fell by 3 points. Why was there a 3% drop in men voting No? This may simply be because men are less likely than women to have already given serious thought to all the negative consequences of the 8th amendment, for example the way it reduces women ability to make medical decisions during a healthy pregnancy.
There is no significance difference otherwise in the Yes votes all the way down this table but opposition from women to Repeal, 12 weeks and even health and FFA is just about significantly higher. The higher No vote among women seems counter-intuitive but there is a simple explanation for this. The highest No voter population by far is the over 55s and in that sub-population women are over represented because men have started to die earlier. So the apparent gender difference may be a result of the comparatively large proportion of women in the over 55 sub-population - we will see this effect again below.
It’s no surprise to see people from 18 to 34 are overwhelming Yes voters, 59% yes to only 18% no. And even that 18% is a substantial fall from the 25% No of the previous month. This is the second biggest shift anywhere in the tables, its a drop of 1/3rd and presumably reflects a rapid education process amongst younger people through discussion and online research. Likewise it’s no surprise that the over 55s are the one group where the No vote has a narrow lead, 35% Yes to 37% No. What is perhaps slightly more surprising is that Yes is also massively carrying the 35-54 age group, 54% Yes to 25% No.
This also very much reflects the composition of those pro and anti-choice campaign mobilisations for marches, canvassing and other street events. All the anti-choice mobilisations are overwhelmingly dominated by people aged 50 and over. The lack of young supporters isn’t just a branding problem for anti-choice organisations that can be fake fixed by putting all the young people on the front banner. It’s looks like its also going to really hit them in the actual vote. This incidentally is why getting a May rather than a June poll could be vital to getting the referendum passed and why if you are heading to a festival the weekend of 25 May you want to be sure to get down the polls first thing in the morning, wellies and all if need be.
It’s also worth pointing out again that this means the two age groups where abortion access may be something that will directly come into their lives are 3:1 voting for Repeal. The 55+ are group intending to vote against is very unlikely to face such a circumstance in their future. This is also an indication that a narrow defeat in the referendum is likely to lead to a second referendum within a few years.
The Red C poll has the age groups divided into 6 groups rather than the 3 groups discussed above. From their results the first two groups covering 18-34 are overwhelming Yes at 68%, the next 3 covering 35-64 are majority Yes and it’s only the over 65s that are majority No at 58%
Here we have to be careful as the tables use a modified version of the UK NRS system which only has a tangential relationship to the way socialists talk about class. Rather than dividing class into workers and bosses the NRS subdivisions are more about what sort of work is done (manual or brain labour) and whether people are working or on welfare. For more on the problems of NRS see the section Class and Leave at https://www.wsm.ie/c/making-sense-brexit-tide-reaction-racist-vote
With that in mind we see little impact on class on the No vote (in the 25-28 range) but on the Yes vote ABC1s (55%) are more likely to be Yes voters than C2DEs (45%). However as E include almost all pensioners the difference here may be largely down to the weight of the over 55 No vote. There is also a F for farmer column but there were only 36 in the sample so the error margin is too large to say anything meaningful about the numbers here.
Over the page is the regional breakdown of voting intentions. This is important data although perhaps also frustrating as there is not that much we can do as individuals about the divisions that show up - they do have a lot to say about the deployment of campaign resources.
The towns and cities are voting Yes by 2:1, a 26 point lead. In rural areas Yes only has a modest 12 point lead. One figure that leaps out though is the huge drop in the rural No vote in comparison with the February poll, its down 10 points, 2/3rds of which became Don’t Knows. The drop is twice the error margin for this sub population size so its a real effect and we’d wonder what the cause of it might be - perhaps simply an impact of a previous lack of conversation about the need for abortion access being overcome by media coverage.
If the lead in urban areas is big in Dublin it’s huge, 3:1, a 40 point lead at 63% to 23%. The Yes vote is weakest in Connacht/Ulster, where Yes with 33% has a tiny 3 point lead. Yes leads by 20 points in the rest of Leinster and by 16 points in Munster. The Don’t Knows are highest in the regions where Yes is weakest, they are only 11% in Dublin but 30% in Connacht/Ulster. This may indicate that the ‘shy vote’ presenting as Don’t Know may shift more heavily to Yes than No because of the long term reliance of anti-choice movements on public shaming tactics.
Our impression is also that the Together for Yes campaign is weakest at the start of the campaign in Connacht/Ulster whereas Donegal has always been a strong point of the anti-choice movement. So this certainly suggests that canvassing and other outreach methods there may have a far bigger proportional impact than they would elsewhere. If you live in Dublin but come from Connacht/Ulster you’d do a lot better to canvass ‘back home’ and chase the 30% Don’t Know than the elusive 11% in Dublin.
This may also be a good point to insert a reminder that there is also a parallel pro-choice struggle along broadly similar lines in the 6 North-East counties of Ulster under British rule. The ‘carnival of reaction’ that followed partition created theocratic states north and south of the border but the continued impact of colonialism in the north has served to preserve clerical influence three decades after its disintegration started in the south. When Repeal is carried south of the border we may become the best available option for pregnant people in the north needing to access abortion. They will of be disproportionately disadvantaged by the requirement for two doctors visits 3 days apart to access abortion pills. This requirement is not simply a pointless inconvenience but something that if passed will deny abortion access to vulnerable segments of the population including those trapped in abusive relationships.
These regional sub populations are all around 250 people meaning the margin of error is around 6% so although there are fascinating fluctuations between the March and February polls almost all are around 3% and so meaningless within the error margin. A few are not, these are;
The reason the No campaign want to centre the 12 week issue is clear when we look at regional variation on the question of unrestricted access to 12 weeks. If this was the question rather than Repeal Yes would carry Dublin and Munster but lose Connacht / Ulster and (by a tiny margin) the rest of Leinster. The concentration of population in Dublin and Cork would mean the referendum would still pass - even if 12 weeks on request was the question - but it would be very tight. This is why the No campaign is trying to centre the conversation on the 12 week question, they want voters to be thinking of that rather than FFA or health at the moment they mark their ballot box.
The other significant shifts are around the FFA & Health access issue - here we see why the Together for Yes campaign will want to centre health & FFA access. The regional differences are huge here, Dublin has an 8:1 lead when you ignore Don’t Knows. Elsewhere the Yes lead on that question is a little over 2:1 except Leinster which is 3:1. If access to abortion for women whose health was under threat and for FFA was the question the referendum would be massively carried everywhere. The problem for the No campaign is that essentially this is the question for anyone who thinks abortion should be available in such circumstances even when they are unsure of the 12 weeks on request issue. All the more so as the 12 week limit is determined by that being the last point abortion pills can be used and the state has already demonstrated it cannot stop hundreds of women using these every year.
There were a couple of significant shifts between February and March on this question
These are real effects several times the error margin. The 15% urban drop is the largest change across both polls. A clue to the cause may be that while the drop is in urban areas it is not reflected in the largest urban area of Dublin.
 Intentions by Party
Over the page we have the tables that provides a breakdown of voter intention by which party was voted for in the previous election. This is a particularly important subset as those most likely to vote in the referendum are those who voted in the last election.
It has to be said at the start that the size of the sub populations here for Labour (42) and the Green Party (9) are too small to draw any conclusions from the data. Otherwise we could waste time considering the plus and minus 20% changes since the last poll but that’s pretty much the error margin and less.
It’s probably not surprising to see that Fine Gael who are in government are over 2:1 Yes. Fianna Fail voters only give the Yes side a 10 point lead over No compared to the 22 point lead for the total population. It’s likely the Fianna Fail Yes is largely their urban vote and that their rural vote is No, one of the major difficulties Fianna Fail faces is the disintegration of their once powerful urban base because of their role in the crash and the pressure of Sinn Fein.
Realistically we can expect rural Fianna Fail to be sitting on their hands and quietly campaigning against the referendum. We’ve certainly see a couple of obvious sock puppet accounts on Twitter whose real owners appear to be rural Fianna Fail activists. As issue in rural areas will be Fianna Fail trying to use the referendum to damage rival candidates, another reason why understanding these polls is important as they are far more likely to try this if they think it will be a close vote. Likewise Fine Gael and Labour politicians in rural areas are less likely to campaign vigorously if they think the vote will be close. This is part of the reason the No spokespeople were very keen to talk up the second RedC poll even though they also must have spotted that the trend across all four polls suggests the apparent shift was an artifact rather than a real finding.
The most significant population bloc in terms of campaigning is found in this table and that is the Sinn Fein voters. In the February poll 26% were Don’t Knows or Won’t Vote but by March both these have fallen drastically resulting in a 7% rise in SF No vote to 30%. We need a little caution here though as the SF population size is only 133 so the 7% growth in the No vote is slightly under the error margin. Sinn Fein is the one political party where over the period the leadership have adopted a strikingly stronger position, in particular over the last few days (ie after the March poll had come out). It could well be this will have a major impact on the figures in the next poll, otherwise republicans will have to switch ‘No Freedom till Freedom for Women’ to ‘your on your own girls’.
To summarise this poll data means that it is likely but not inevitable that the Yes vote will win. The lead is significant and the trend is favourable but there are a lot of Don’t Knows and if they all become No’s and the over 55s turn out in droves while the under 35s fail to show than the result could be very close.
In addition we can expect a massive increase in the volume of dirty stealth ads to appear in the last week of the campaign. These will attempt to create moral panics and play on prejudices when there will not be enough time to address these. The conversations we have with workmates, friends and relative between now and then can be used to inoculate people against this tactic, the Cambridge Analytica investigation breaking when it did is useful in that regard to encourage people to question the funding and truthfulness of the dirty stealth ads as they appear.
We conclude by saying that a ‘women’s right to choose’ is no more subject to the popular whim than slavery. The logic of the passing of the 8th was the attempts to ban information and travel that quickly followed. A 2:1 majority did not stop our fight against those. If by some disaster Repeal is defeated then the day after pregnant people will still be illegally importing pills for use in Ireland and travelling to obtain abortions elsewhere. A no vote won’t stop abortion, it will just extend the period of illegality and force thousands to continue to travel or break the law here and risk a 14 year prison sentence.
Together for Yes website